

Quarter in Review: Turn! Turn! Turn!
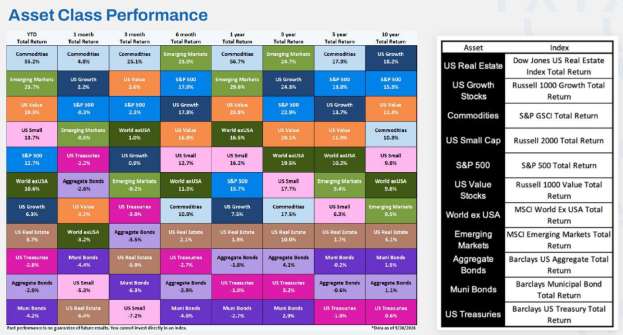
The Byrds sang about the turning of seasons in their 1965 #1 song. Markets have seasons too, though they don't conform neatly to a calendar. This quarter, stocks and bonds were in different ones. The S&P 500 returned 2.3% for the third quarter and 12.7% year to date, but leadership was narrow. The Russell 2000 (Small Cap) fell 7.2%, though it is still up 13.7% for the year.1,2 Rates, however, were the main event. The 10-year Treasury yield rose from 4.44% at the end of June to 5.29%, and bonds paid for it: the Bloomberg U.S. Aggregate Bond Index fell 3.5% for the quarter and the Bloomberg Municipal Bond Index 6.3%.3 Commodities ruled the quarter, with oil doing much of the heavy lifting. The S&P GSCI was up 25.1%. The Federal Reserve raised rates a quarter point on September 16, and the economy kept growing.
US Equities
Third-quarter leadership reversed the pattern of the second quarter, with Energy (up 17.2%) and Information Technology (up 7.2%) leading. IT alone contributed more than the index's entire 2.30% return, so the other ten sectors combined subtracted from it.1 Leadership has seasons, but they do not run on a schedule.
Beneath the sector rotation, the market's support came from earnings more than enthusiasm. Consensus estimates call for 2026 S&P 500 earnings per share to grow 31.6%.
For perspective, the average over the last 25 years has been 7.6%. Stock prices rose, but earnings estimates rose faster. As a result, the market became cheaper as it climbed. The forward P/E is 19.0x, down from 22.0x in January. That is lower, but not low. The 30-year average is about 17x.4
Concentration remains the defining feature. The ten largest companies are about 40% of S&P 500 market capitalization, which invites comparisons with 2000. The S&P 500 Information Technology sector currently trades at about 21x forward earnings. It was about 55x at the March 2000 peak.4
FUN FACT In 2025, the Magnificent 7 beat the other 493 in the S&P 500 by 10 percentage points. In 2023, the margin was 65! What's the margin this year? Zero. Through September 30, the Magnificent 7 and the S&P 493 have each returned 12% on a price basis.4
Fixed Income
Bonds had a hard quarter as yields rose across the curve. The Agg was down 3.5% and the Bloomberg U.S. Treasury Index lost 3.0%. Municipal bonds, usually the quiet corner of a portfolio, had it worse, losing 6.3%, including a 4.4% September loss that was the worst month for munis since 2008.5 The additional pain in munis can be attributed to the longer duration of most muni portfolios and indices. Heavy muni issuance and late-September fund outflows added further pressure to muni prices.
Where things go from here is less than clear. The Fed and the market are not in full agreement about the near future. The Fed's own projections put the policy rate at 4.1% at the end of 2027, while market pricing implies 4.9%, which means investors expect higher rates than the Fed does.6
There's a silver lining in bond math though. Starting yield is the most important determinant of subsequent five-year returns on a bond portfolio, as the analysis from J.P. Morgan below illustrates. A quarter-end yield of 5.56% on the Agg implies roughly 5.7% annualized over the next five years (a historical relationship, not a promise).6 After a turbulent season of price losses, bonds pay more than they did in June. Higher yields compensate investors for waiting, but they do not indicate when prices will turn. Munis add a bonus tax overlay: for an investor in the top federal bracket, the broad municipal index yielded the equivalent of about 8% at the end of the quarter, and the 10-year AAA muni yield beats the 10-year Treasury yield for the 24% federal bracket and above.5
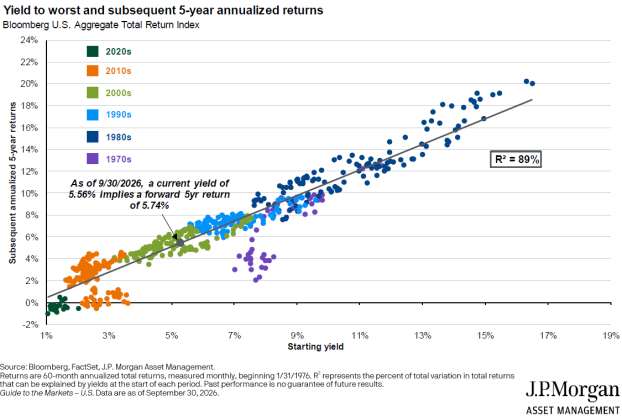
Higher yields and mixed signals on where rates go next leave many asset allocators leaning toward a "neutral" allocation to bonds: stay the course. Similarly, many muni managers point to current valuations and fundamentals as attractive while acknowledging that rates may go up more before the market stabilizes.
International Markets
International stocks have kept pace with or beaten U.S. stocks over the past year, but not this quarter. Over twelve months the MSCI EAFE Index returned 15.7%, matching the S&P 500, and the MSCI Emerging Markets Index 29.2%. In the third quarter, both trailed.7 Even so, international stocks still trade at a wider discount to the S&P 500 than the 20-year average.4 One caution when reading the headlines about "emerging markets": how EM performed depends on the index you are looking at. Through September 30, the MSCI Emerging Markets Index was up 23.4% for the year and the FTSE Emerging Index 10.9%. Why the difference? South Korea (up 98%) is about 20% of the first and absent from the second.7,8,4
Alternatives
Commodities were the quarter's standout. The S&P GSCI Energy Index rose 45.0% in the quarter, though WTI crude ended September at $90 a barrel, below its April peak of $113.
So even this year's big winner has had its rough stretches.1,8 Real estate was mixed, with the S&P 500 Real Estate sector down 5.6% in the quarter and up 5.3% year to date.
BONUS FUN FACT The S&P 500 has set 27 all-time highs so far in 2026. That might sound like a warning, but since 1950, 80% of all-time highs were followed by another high within one week. From 1988 through 2025, investing at a new high produced an average cumulative S&P 500 total return of 82% over five years, versus 76% for investing on any random day.4 Peaks are where the good news tends to be, which is also why they feel risky.
Closing Perspective: Seasons Without a Calendar
The third quarter handed investors two seasons at once: stocks that kept climbing on earnings while leadership narrowed, and bonds that fell as rates rose. Nothing in the data says when either will turn, and the Fed and the market do not fully agree on where rates go next.
What the quarter does show is where things stand today. U.S. stocks have gotten cheaper on earnings even as the index sits near record highs. Bonds pay more than they did in June. International stocks trade at a significant discount. None of that is a forecast, but it is useful context for the diversification and discipline that have always been the plan. Investors who hold a mix of stocks and bonds, at home and abroad, do not need to guess the date of the next change of seasons.
Sources: S&P Dow Jones Indices; YCharts; Clearnomics; J.P. Morgan Asset Management; BlackRock; Nuveen; FTSE Russell; Bloomberg. Unless otherwise noted, data as of September 30, 2026.
Notes
1. S&P Dow Jones Indices, "Index Dashboard: U.S.," September 30, 2026, p. 1. Total returns in U.S. dollars as of September 30, 2026: S&P 500 (third quarter 2.30%, year to date 12.75%; J.P. Morgan and YCharts report 12.7%); S&P 500 sector returns and third-quarter sector contributions (Information Technology contributed 2.72 percentage points of the index's 2.30% return, so the other ten sectors combined contributed -0.42 points); S&P GSCI and S&P GSCI Energy; S&P 500 Real Estate sector.
2. YCharts, "Monthly Market Wrap," September 2026 (released October 5, 2026), p. 3, "Asset Class Performance." Total returns through September 30, 2026. Russell 2000 Index: 3-month -7.2%, year to date 13.7%. Bloomberg U.S. Aggregate Bond Index - 3.5%, Bloomberg U.S. Treasury Index -3.0% and Bloomberg Municipal Bond Index -6.3%, all 3-month.
3. Clearnomics, "Market and Economic Chartbook: Summary Quarterly Update," October 5, 2026, p. 3, "Economic Update" table: quarter-end 2-year (4.14% to 4.88%) and 10-year (4.44% to 5.29%) Treasury yields for 2Q26 and 3Q26. J.P. Morgan Guide to the Markets, p. 34, shows the same 10-year yield of 5.29% at September 30, 2026.
4. J.P. Morgan Guide to the Markets, 4Q 2026 (data as of September 30, 2026). p. 5: S&P 500 forward P/E of 19.0x against a 30-year average of 17.2x. p. 7: 2026 consensus earnings growth of 31.6% against a 2001 to 2025 average of 7.6% (Compustat, FactSet, S&P). p. 8: the ten largest companies are 40.6% of S&P 500 market capitalization. p. 10: price returns of the S&P 500, S&P 493 and Magnificent 7, 2023 to 2026 year to date; figures are rounded to whole percentages in the source, "each returned 12%" reflects that rounding, and the 65 and 10 percentage point margins are calculated from the rounded figures. p. 46: S&P 500 forward P/E of 22.0x on January 1, 2026 and 19.0x at September 30, 2026; MSCI ACWI ex USA forward P/E at a 32% discount to the S&P 500, against a 20-year average discount of 20%. p. 62, "Investing at all-time highs": S&P 500 price index, daily, 1950 to present: 27 all-time highs year to date and 80% of all-time highs followed by another within one week; average cumulative S&P 500 total returns over five years, January 1, 1988 to December 31, 2025, investing at a new high (82%) versus on any day (76%). Source: FactSet, Compustat, Standard & Poor's, MSCI, J.P. Morgan Asset Management. BlackRock, "Student of the Market," September 2026, data as of August 31, 2026. p. 5, "AI boom remains well below dot-com extremes": S&P 500 Information Technology Sector GICS Level 1 Index 12-month forward P/E, about 55x at March 2000 and about 21x at August 2026 (approximate, read from chart labels). p. 6, "Emerging market stock index differences are large": South Korea is 20.85% of the MSCI Emerging Markets Index and 0% of the FTSE Emerging Index as of August 31, 2026. Source: Bloomberg, BlackRock.
5. Nuveen, "Muni Minute" (Dan Close, October 5, 2026). Bloomberg Municipal Bond Index total return: September -4.36%, third quarter -6.3%. Open-end muni fund flows -$2.7 billion and ETF flows +$2.1 billion, September 24 to October 1 (LSEG Lipper, J.P. Morgan). Tax-equivalent yield of 8.07% for the broad index at the top federal bracket of 40.8% (37% plus the 3.8% Medicare tax), as of October 1. The 10-year break-even bracket of about 24% is calculated as 1 minus 4.04% (Nuveen, MMD AAA 10-year yield, October 1) divided by 5.29% (J.P. Morgan Guide to the Markets, p. 34, 10-year Treasury yield, September 30); federal tax only, state taxes not included. Nuveen attributes the losses to rates rather than credit and manages municipal bonds. Bloomberg, "Munis See Worst Monthly Returns Since Lehman Collapse" (October 1, 2026).
6. J.P. Morgan Guide to the Markets, 4Q 2026 (data as of September 30, 2026). p. 32, "Bond yields and inflation": Bloomberg U.S. Aggregate Bond Index yield of 5.56%. p. 41, "Fixed income yields and forward returns": yield and subsequent 5-year annualized returns, monthly from January 1976 (R-squared of 89%); a 5.56% yield implies a 5.74% forward 5-year annualized return. This is a historical relationship, not a forecast or guarantee. p. 31, "The Fed and interest rates": FOMC September 2026 projection of 4.10% for the end of 2027 and USD overnight index swap pricing of 4.87%.
7. YCharts, total returns through September 30, 2026 (monthly). MSCI EAFE Net Total Return Index: 3-month 0.81%, year to date 10.33%, 1-year 15.69%. MSCI Emerging Markets Net Total Return Index: 3-month -0.37%, year to date 23.38%, 1-year 29.22%. S&P 500 Index: 3-month 2.30%, 1-year 15.74%. Net total return indices reflect the reinvestment of dividends after withholding taxes. MSCI Korea Index, year to date through September 30, 2026: up 98% (YCharts). FTSE Russell, FTSE Emerging Index factsheet, data as at month end September 30, 2026, total return in U.S. dollars (gross): year to date 10.9%.
8. J.P. Morgan Guide to the Markets, 4Q 2026, p. 28, "Oil markets." WTI crude oil (NYM continuous contract) of $90 at September 30, 2026 and $113 on April 7, 2026.
Important Disclosures
Securities and investment advisory services offered through Osaic Wealth, Inc. member FINRA/SIPC. Osaic Wealth is separately owned and other entities and/or marketing names, products or services referenced here are independent of Osaic Wealth. This communication is strictly intended for individuals residing in the states of AR, AZ, CA, CO, CT, FL, GA, HI, ID, IL, IN, KS, LA, MA, MD, ME, MI, MN, MO, MS, MT, NC, NJ, NM, NV, NY, OH, OK, OR, PA, SC, TX, UT, VA, VT, WA, WV, WY. No offers may be made or accepted from any resident outside the specific state(s) referenced.
Securities and investment advisory services offered through Osaic Wealth, Inc. member FINRA/SIPC. Osaic Wealth is separately owned and other entities and/or marketing names, products or services referenced here are independent of Osaic Wealth.
Securities and investment advisory services are offered through Osaic Wealth, Inc., member FINRA/SIPC. Osaic Wealth is separately owned, and other entities and/or marketing names, products or services referenced here are independent of Osaic Wealth. The information on this site is for general education and is not individualized investment, tax, or legal advice. Neither Osaic Wealth nor its representatives provide tax or legal advice. Investing involves risk, including the potential loss of principal. No strategy assures a profit or protects against loss in a declining market. Past performance is not a guarantee of future results.